As an avid cloud engineer working with AWS, you might have encountered slowdowns in your pipelines. If so, it's time to take a closer look at CloudWatch Metrics!
Where to Find the Right Metrics
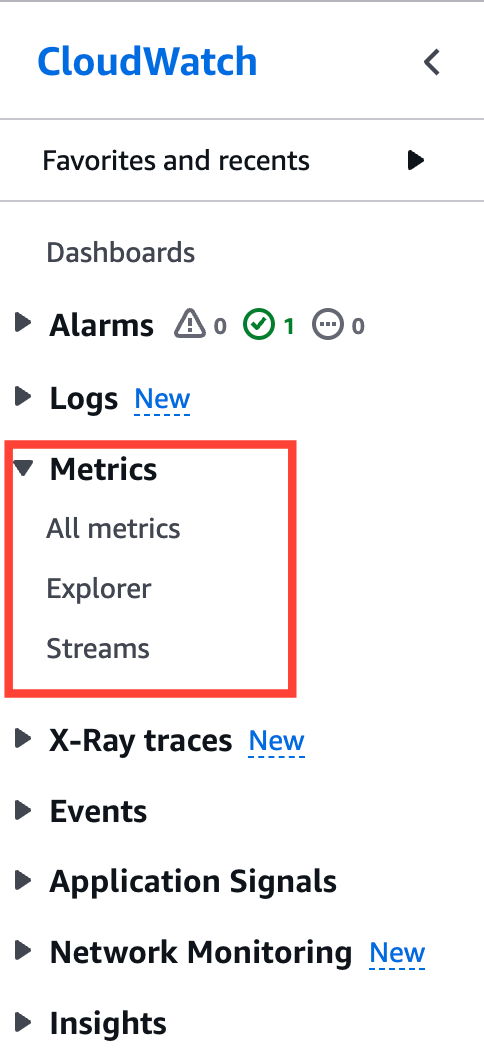
You can access CloudWatch Metrics directly in the AWS Console. From there, navigate to the Explorer, a powerful tool that allows you to analyze all AWS service metrics in one place. It supports key Compute services like Lambda and EC2, as well as S3, SNS, CloudWatch Logs, and more.
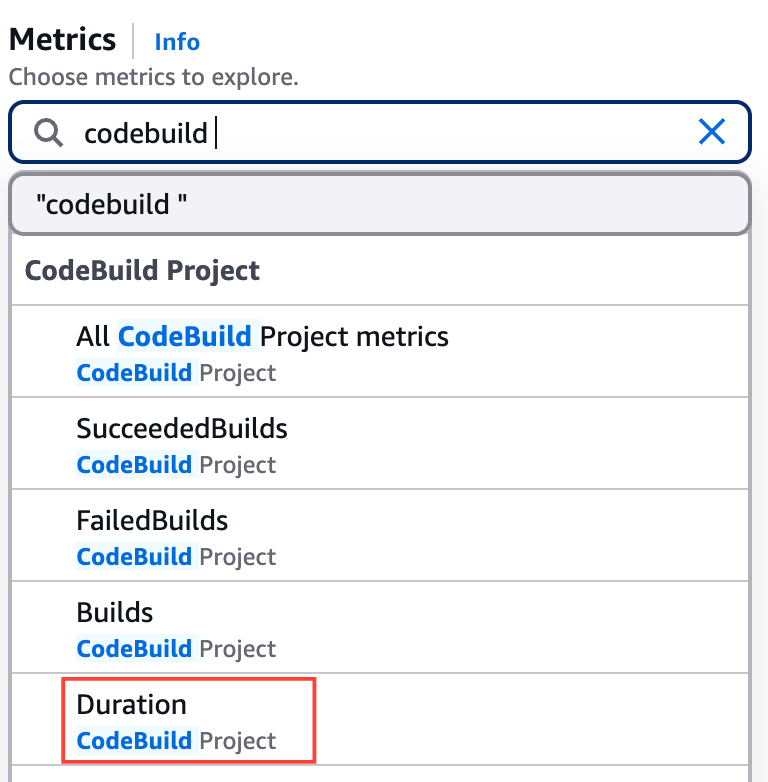
For pipeline performance, we’ll focus on the "Duration" metric for CodeBuild Projects.
Selecting the Right CodeBuild Project
At first, selecting "Duration" might not show any results. To get relevant data, you need to filter by a specific CodeBuild Project using the "From" field.
Use the following filter:
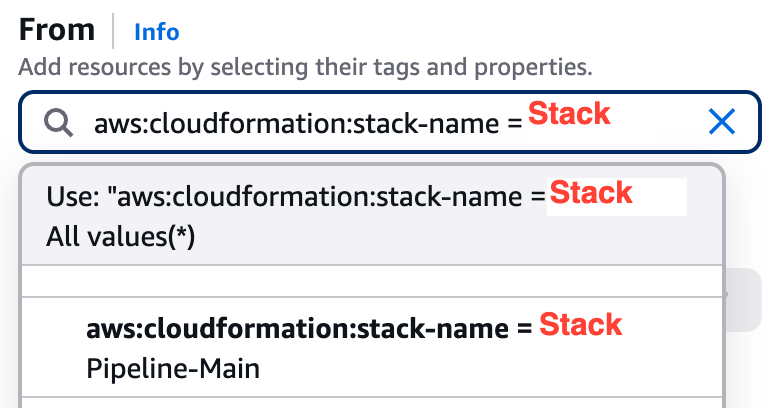
Once selected, your metrics will load and should display a graph. If not, try adjusting the time frame in the top-right corner.
Aggregating Data for Better Insights
If you're troubleshooting a specific step in your pipeline, the basic view might be enough. However, to get a broader, aggregated perspective, you need one more tweak.
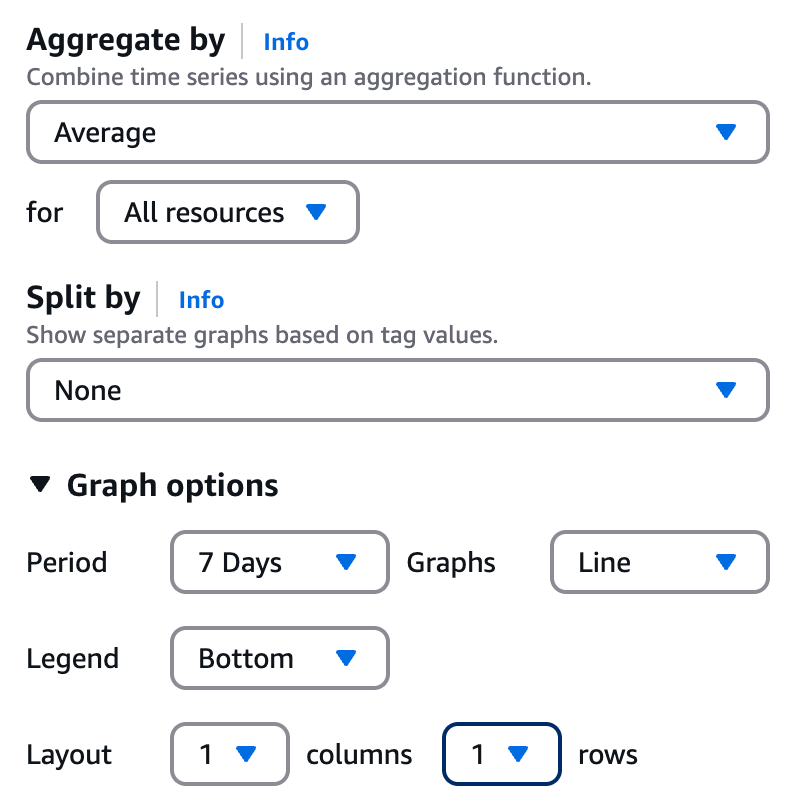
Recommended Settings:
- Aggregate by → Set to Average
- Graph Options → Period → Set to 7 days
This setup helps you identify trends and performance bottlenecks over time.
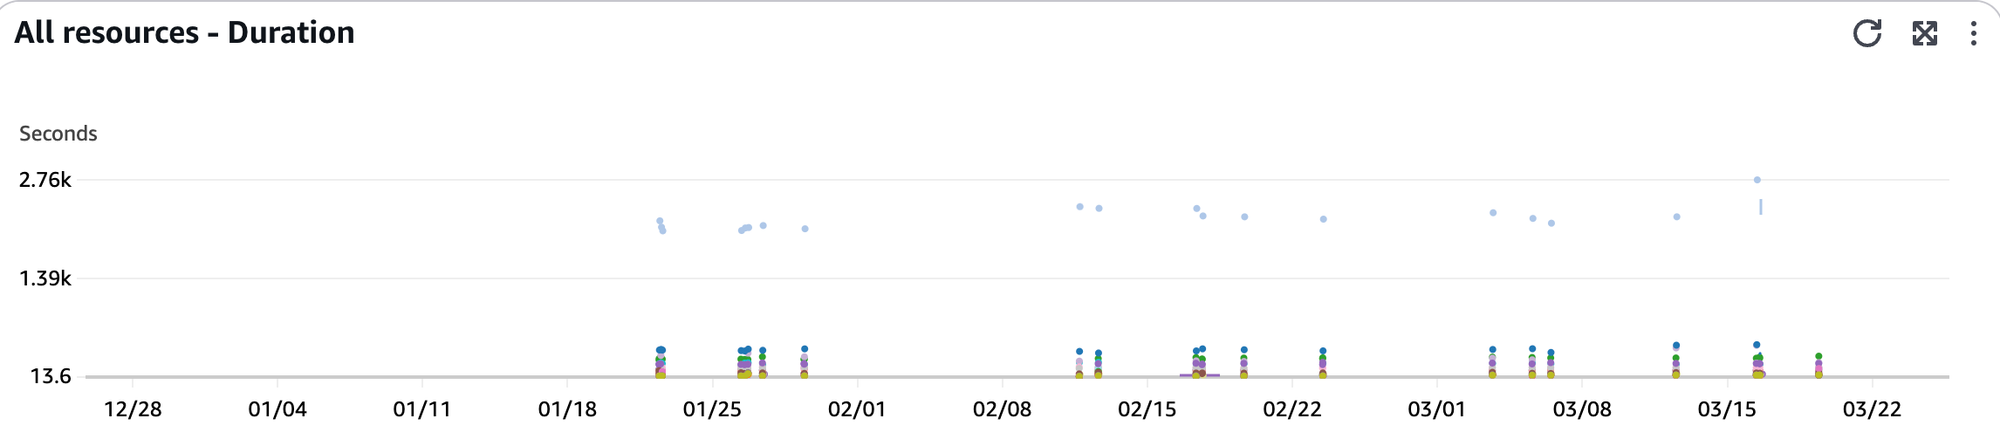
Final Result / Time for improvement
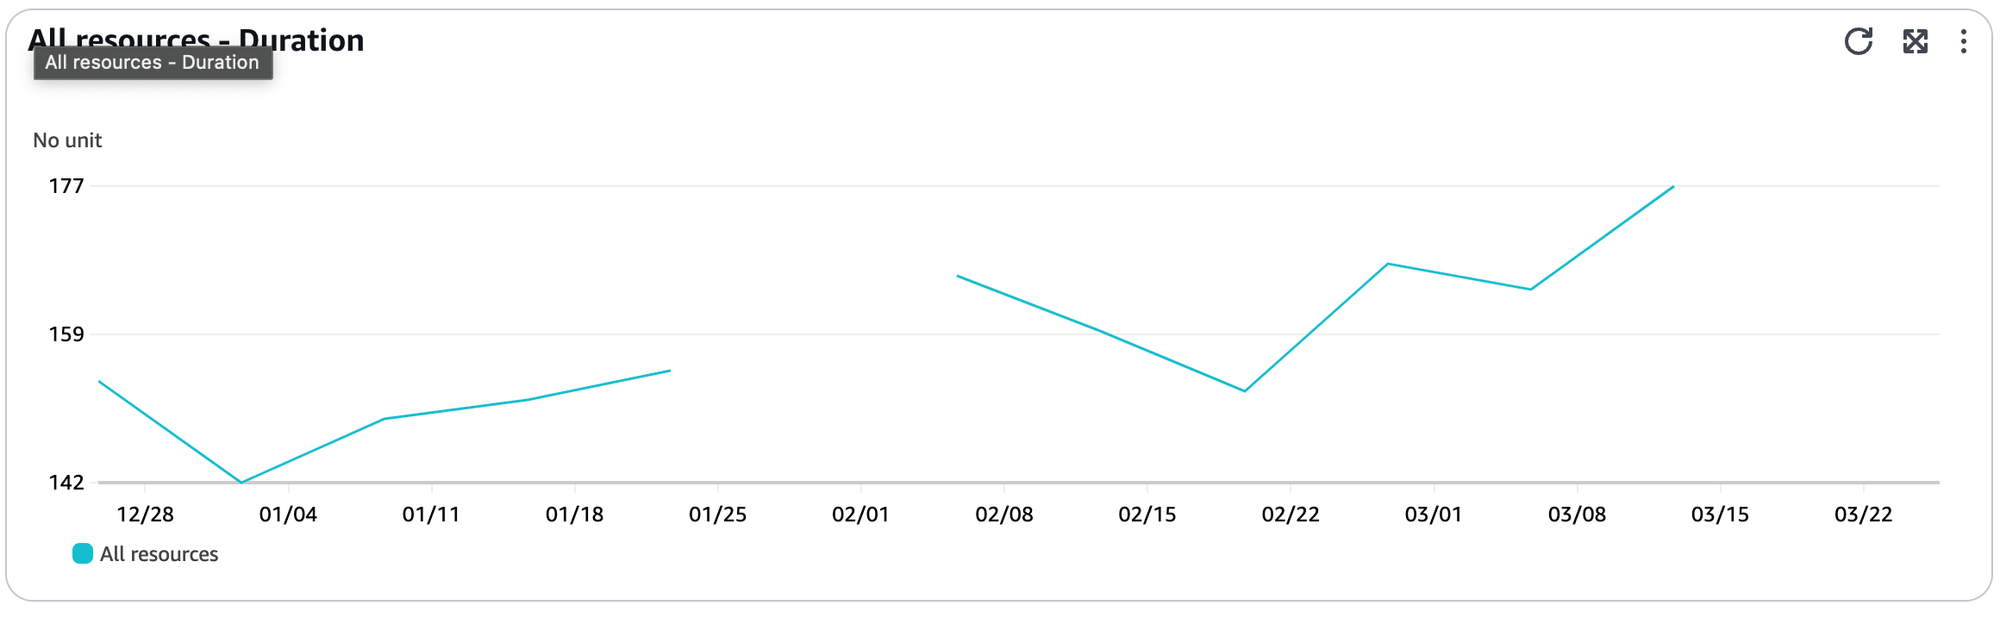
Looking at the data, you might notice that our pipeline performance over the past three months hasn’t been great 😦—but now, with these insights, we can take action and improve! 🚀
Final words
By leveraging CloudWatch Metrics, you gain a powerful tool to diagnose and optimize your AWS pipelines. What once seemed like an unexplained slowdown now becomes a data-driven opportunity for improvement. With the right filters, aggregation, and visualization, you can spot trends, identify bottlenecks, and take proactive steps to enhance performance.